Chapter 10 Wrapping up
It is the final week, so let me start with some general reflections to wrap up the unit. I know some of you may think, why the hell am I learning coding and stats? You may think the contents of this course may ultimately not be of direct benefit to you. But we have designed this experience in such a way that you also acquire a set of skills and tools to learn how to confront challenging problems (even those you may think you hate). Life will throw many of those kind of problems at your door. Having survived this module, we believe may have also taught you a thing or two about the importance of task persistence; overcoming your frustration to obtain results; dealing with your insecurities and the understandable emotions they generate; being more organised about your work; collaborate with others in the same situation; the importance of attention to detail; etc. Hopefully, we also helped you to develop a greater sense of curiosity and to achieve the immense satisfaction one gets when one cracks a challenging problem that may have had us screaming at the computer screen for what may have felt like hours. We know a course like this may get you out of your comfort zone. But we firmly believe that it is worth it. And that you will get something out of it, even if it may not be terribly obvious to you now.
And with that, let’s move to this final session. We are not going to cover new techniques today. There may be a few tips about the presentation that you may find helpful. The document in Blackboard about how to write your analytical report is quite detailed already. But there are a few additional tips you may find helpful.
10.1 Tips for the assignment
You should all now be familiar with the assignment you have to do. In the Blackboard page for this course unit you can obtain the assignment brief and additional guidance we have prepared. This guidance aims to answer most of the questions about what you need to do and how. It is very detailed, and it has been built with feedback from many students who have taken this module before. That guidance aims to provide you with a helping hand during the process.
Critically you have never written anything like this before, so it is expected to have questions. It may help you to read any article in any of the top journals in our field such as Criminology, the Journal of Research in Crime and Delinquency, or if you like “hard drugs” the Journal of Quantitative Criminology to get an idea of the templates that criminologists follow when writing a research report. Looking at good templates such as the ones you will encounter in those journals will give you good ideas about how to tell your story. Keep in mind those journal articles are subject to a more generous word count than you will have here, so you will have to be even more succinct and parsimonious. If you are spoiled by choice and hesitant about which paper to choose, have a look at this one by Chris Melde and Finn Esbensen from 2009.
For any additional questions, you can follow the sequential 5 “Bs” approach designed to enhance autonomy that primary schools follow these days: brain, book, board, buddy, boss. Start with the first and move to the next one if you get stuck.
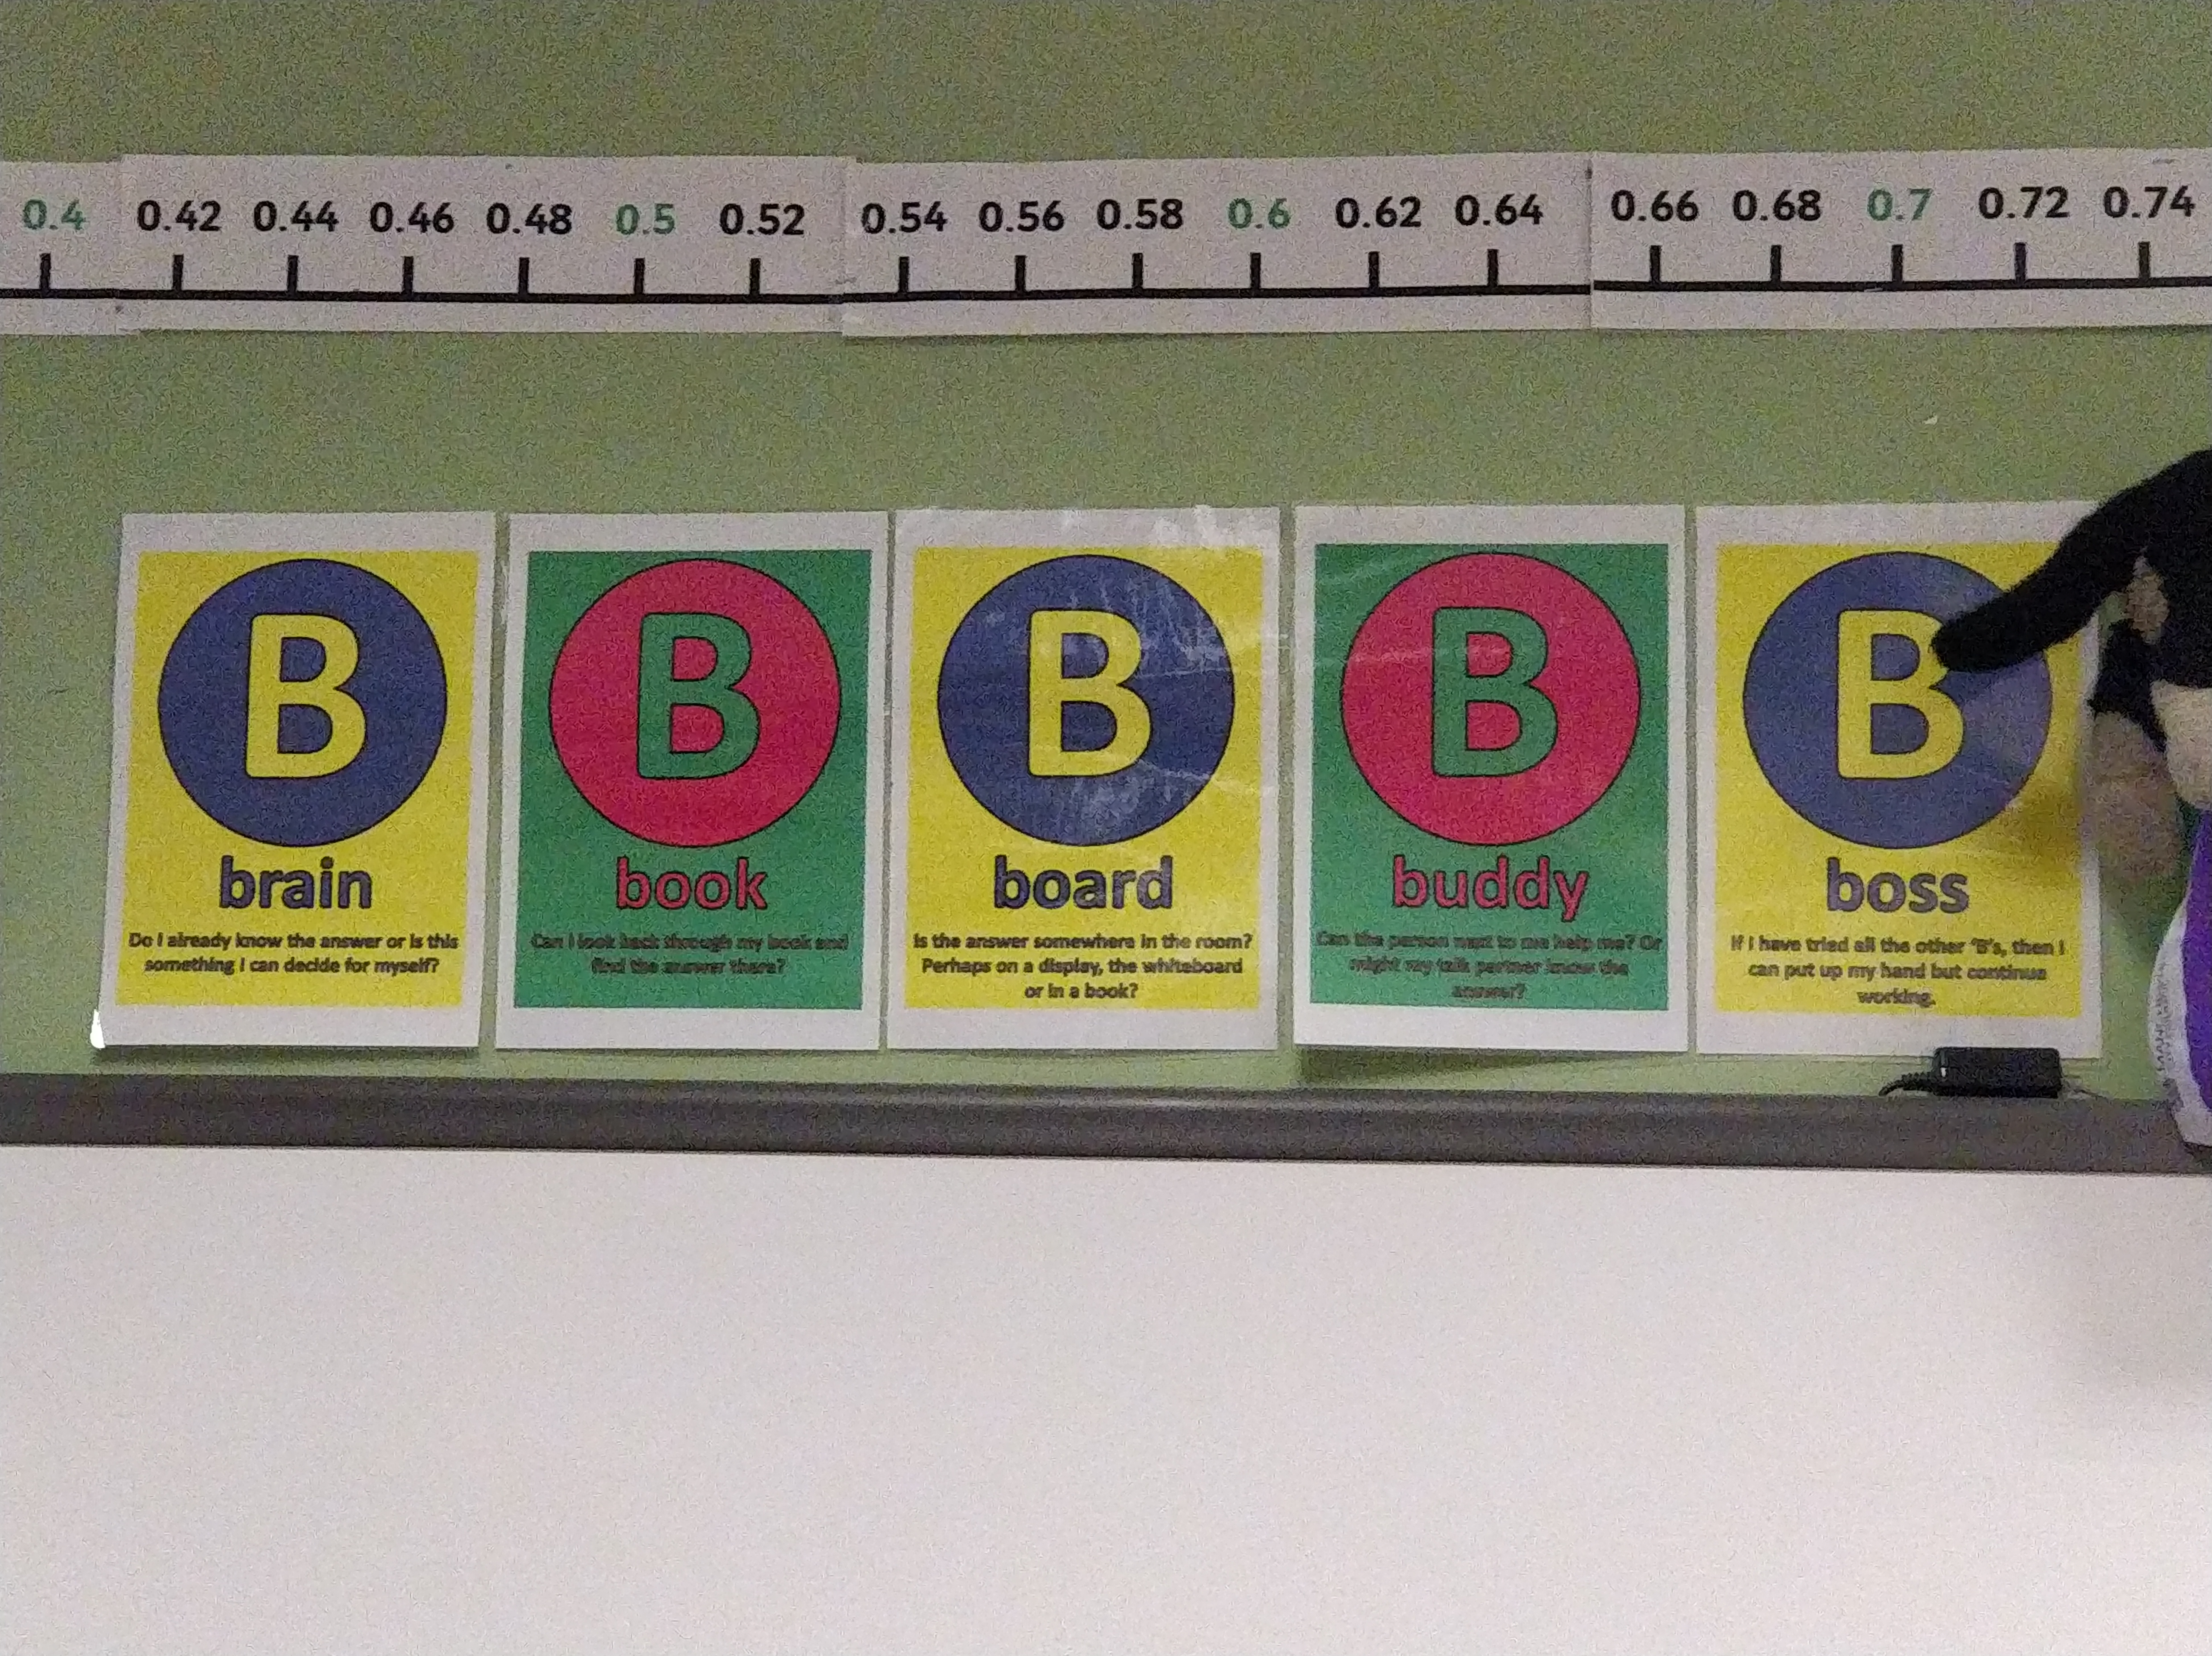
- Brain: “Do you already know the answer, or is this something you can decide for yourself?”
- Book: “Can I look back through my learning materials and find the answer there?”
- Board: “Is the answer in the discussion board?”
- Buddy: “Can one of my peers answer this question?” (if unconvinced by their answer, you can move to the next B)
- Boss: “If I have tried all the other Bs, then I can put up my hand but continue working” (and remember here, you should first try to ask in the discussion board or the labs, and failing that make an appointment through office hours)
A scientific report, like the one you are tasked to write, needs to be straightforward, well-justified, and very efficient in the use of space. It will be helpful for you to finish ahead of time and dedicate some time simply to edit your final essay. This is, in fact, a general piece of advice for any essay you write. But in this case, perhaps matters more. You will have done loads of things as part of your analysis but will have a very limited word count to tell the story of your analysis. Every word and every sentence must be needed. There is always a shorter and more parsimonious way of saying something! And, please, use the spelling editors of whatever app you use to write your essays. It is not cool to send essays with typos and grammar errors that any app can automatically detect these days.
Here, we are going to cover a few things you can do to make this presentation more succinct and parsimonious.
10.2 Summarising your variables
The paper by Melde and Esbensen (2009) cited above provides an example of how you may want to describe your variables in the text. As noted, you may not have as much space to get into so much detail, but the core idea you need to take home is that the reader needs to know what variables you are using and how they are measured. You will also need to provide a succinct summary of the descriptive measures for your variables. Look at this paper by Andromachi Tseloni and Christina Zarafonitou (2008). Below I reproduce a table from the pre-print version of this article with a summary of the variables they are using in their analysis:
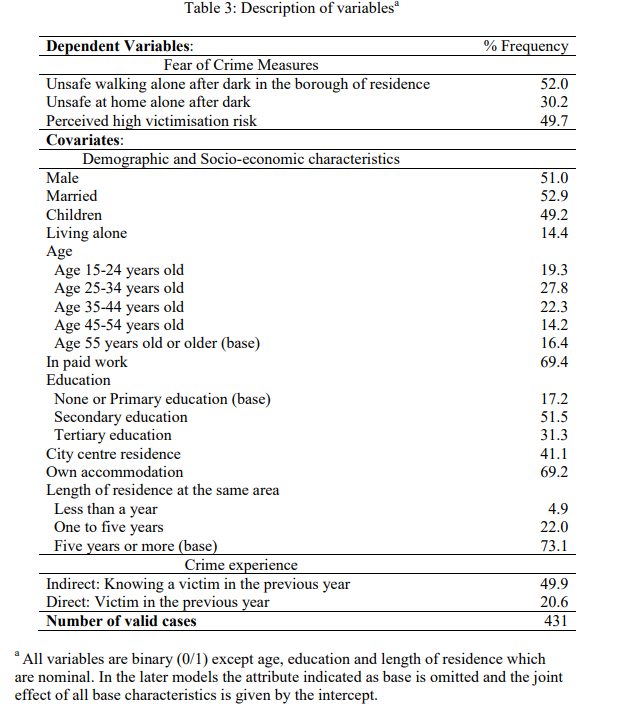
This is a very succinct way of describing the distribution of your variables when all are categorical. If you have numerical variables as well, you could add another column with the mean and the standard deviation (the latter enclosed in brackets)– -which would only have this information for your quantitative variables.
Notice that this table has a minimum amount of ink and only lines separating cells when absolutely necessary. If you are uncertain how to modify the default tables your word editor uses, this file gives you some tips on how to do it with MS Word. It will be similar to other apps.
Notice that information about the total sample size is provided as well. Remember what we cover at the end of section 4.9!
As we have said, we want you to look at whether your variables are associated before you run your multiple regression model. We do this so that we can evaluate if you have learnt how to choose the right tests and measures of effect size.
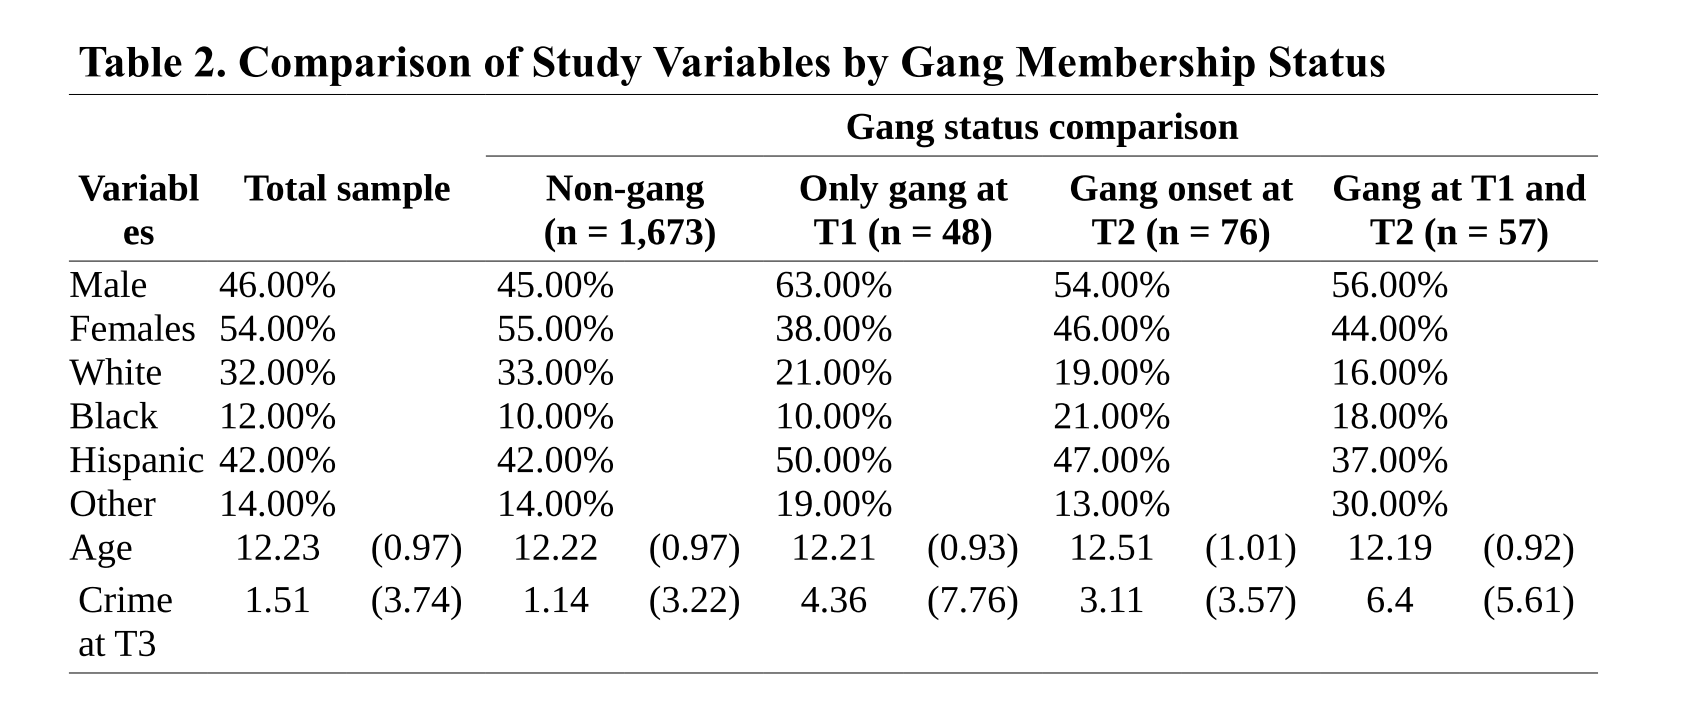
Above, I am reproducing an example of how you could do this. The example assumes you have a categorical dependent variable with four different categories (non-gang, gang only at T1, etc.). You can see how the categories define the column in this table (there is also one for the total sample; if you have something like this, you are essentially providing the summary descriptives for the whole). You can see that the rows define the levels for two categorical variables (gender and race/ethnicity) and two quantitative variables (age and a score for crime). For the categorical variables, we have the appropriate percentages (as discussed in week 7), and for the quantitative variables, we have the means and standard deviations. Remember how you set this table may differ depending on the nature of your variables, but hopefully, you get the idea. You can find a way to summarise the information. You could add a column to a table like this with the p values for your statistical tests (somehow indicating what that test was: chi-square, F, etc.). Then, you could discuss the more relevant of this in the narrative discussing your table.
10.3 Some final words
So, this is the end, at least for now. What we have done this semester is an introduction to the field of data analysis. But there is so much more to it. The journey is just beginning if you are planning a scientific career or want to work as an analyst in the private or public sector. You could make some choices in the final year to continue this journey. There are some options within our degree (like Comparative Criminology in Semester 1, Crime Mapping in Semester 2, or the Quantitative Dissertation pathway, one of the possible modalities for your dissertation). You could also take options in other degrees within the School of Social Science that also have a focus on quantitative analysis (we can advise on these). After that, you might want to think about our MRes in Criminology (Social Statistics), which focuses on quantitative analysis as part of the criminology track. You can see details here.
But there are many free courses offered, such as massive online open courses, that you could take to consolidate or further expand what you have learnt this semester. Check out Coursera or edX platforms for these. Many of those courses make you pay for a certificate (and if you want to get feedback), but you can watch the videos and use the materials for free in almost all of them. You may also want to have a look at datacamp. Most of their courses require a paid subscription, but there are many free courses (particularly those created by the community).
Good luck with the essays!!! And do not hesitate to get in touch if you have any queries.